
A production server crashes at 3 AM. Users start sending angry messages. You log in through SSH and try to understand the problem. Without proper logs, you are blind, scanning random print statements and guessing what failed.
After ten years of building Python systems that handle millions of requests, one lesson is clear: monitoring and logging are basic needs, not extra features. The gap between a small issue and a full outage often depends on how fast you can find the cause.
This guide covers essential monitoring and logging tools that work reliably in production in 2026. These tools are well-proven, handle real traffic, and help teams detect and fix problems quickly at scale.
IF YOU ARE A NON-MEMBER CLICK ON THE FRIEND LINK -https://medium.com/@inprogrammer/best-python-monitoring-logging-tools-2026-complete-guide-77666206b57d?sk=3aadd69489b66a7b3c09dcd3de5c9ea1
Why Traditional Print Statements Fail at Scale
Every Python developer begins with print debugging. It works for small scripts and local testing, but it fails once an application grows beyond a single file or machine.
In production, print output is often lost, lacks time and importance levels, and becomes confusing when many processes run at once. You cannot easily search or filter it. Proper logging tools fix this by adding timestamps, severity levels, file and line details, and structured data. They connect with monitoring systems and warn you early. During a real production failure at 3 AM, this difference becomes very clear.
The Logging Foundation: Python's Built-in Logging Module
Python's standard logging library forms the foundation that most other tools build upon. It provides a flexible framework with five severity levels: DEBUG, INFO, WARNING, ERROR, and CRITICAL.
Here is how to set up basic logging correctly:
import logging
import sys
logging.basicConfig(
    level=logging.INFO,
    format='%(asctime)s - %(name)s - %(levelname)s - %(message)s',
    handlers=[
        logging.FileHandler('application.log'),
        logging.StreamHandler(sys.stdout)
    ]
)
logger = logging.getLogger(__name__)
logger.info("Application started successfully")
logger.error("Failed to process user request", exc_info=True)
This configuration writes logs to both a file and stdout, includes timestamps and context, and captures exception tracebacks automatically. For production applications, implement log rotation using RotatingFileHandler to prevent disk space issues.
Structlog: Making Logs Machine-Readable
Modern applications need logs that machines can read and analyze. Structlog converts logs from plain text into structured JSON, making filtering and analysis much easier. This is especially important when collecting logs from many services or setting up automatic alerts.
The main benefit of structured logging is easy searching. Instead of using grep or complex patterns, you can query logs like a database. Finding payment failures for one user or calculating error rates per endpoint becomes fast and simple.
Implementation looks like this:
import structlog
structlog.configure(
    processors=[
        structlog.stdlib.add_log_level,
        structlog.processors.TimeStamper(fmt="iso"),
        structlog.processors.JSONRenderer()
    ],
    wrapper_class=structlog.stdlib.BoundLogger,
    logger_factory=structlog.stdlib.LoggerFactory(),
)
log = structlog.get_logger()
log.info("user_login", user_id=12345, ip_address="192.168.1.1")
log.error("payment_failed", amount=99.99, error_code="CARD_DECLINED")
The JSON output makes it trivial to search for all failed payments or track a specific user's journey through your application. When integrated with log aggregation systems like ELK or Datadog, structured logs enable sophisticated analysis and monitoring capabilities that text logs simply cannot provide.
Loguru: The Developer-Friendly Alternative
Loguru simplifies Python logging with smart defaults and almost no setup. It adds colored console output, manages log file rotation, and removes the extra setup needed by the standard logging module.
Its strongest feature is exception logging. When an error happens, Loguru records the stack trace along with local variable values. This detail is extremely helpful for finding production-only bugs that are hard to recreate locally.
Getting started takes just a few lines:
from loguru import logger
logger.info("Application started")
logger.warning("High memory usage detected: {usage}%", usage=87)
try:
    risky_operation()
except Exception:
    logger.exception("Operation failed")
logger.add("app_{time}.log", rotation="500 MB", retention="10 days")
The rotation parameter automatically creates new log files when the current one reaches 500 MB, preventing disk space issues. The retention parameter ensures old logs are deleted after 10 days, maintaining a reasonable storage footprint. These features work out of the box without additional configuration or external tools.
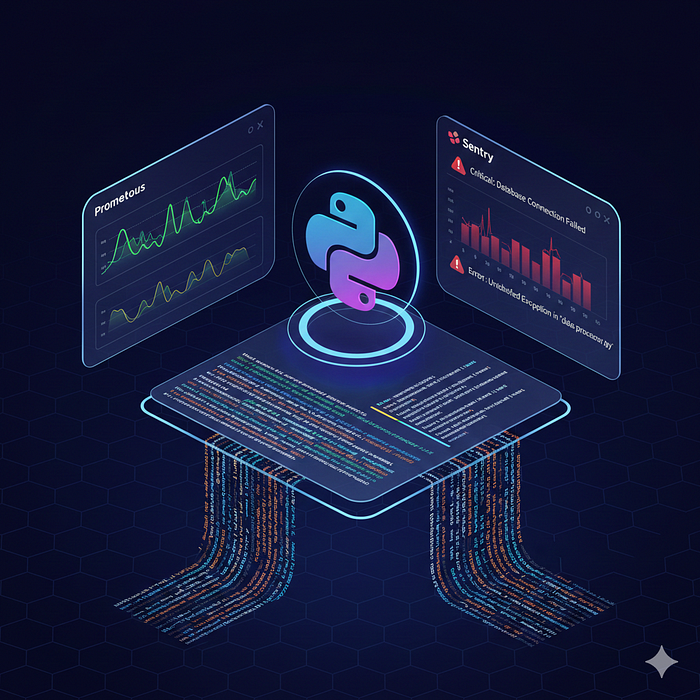
Prometheus Client: Metrics That Matter
Logs show what happened. Metrics show how well your system runs. The Prometheus client library shares app metrics in a format Prometheus can collect and study. Logs record single events, while metrics combine data over time to reveal trends.
Prometheus offers Counters for values that only go up, Gauges for values that go up and down, Histograms for value ranges, and Summaries for percentiles. Each type helps monitor a different part of system behavior.
from prometheus_client import Counter, Histogram, generate_latest
from flask import Flask, Response
import time
app = Flask(__name__)
request_count = Counter('http_requests_total', 'Total requests',
                       ['method', 'endpoint', 'status'])
request_duration = Histogram('http_request_duration_seconds',
                            'Request duration', ['method', 'endpoint'])
@app.before_request
def before_request():
    request.start_time = time.time()
@app.after_request
def after_request(response):
    duration = time.time() - request.start_time
    request_duration.labels(method=request.method,
                          endpoint=request.endpoint).observe(duration)
    request_count.labels(method=request.method,
                        endpoint=request.endpoint,
                        status=response.status_code).inc()
    return response
@app.route('/metrics')
def metrics():
    return Response(generate_latest(), mimetype='text/plain')
Connect Prometheus to Grafana to build real-time dashboards and alerts.
Sentry: Error Tracking That Actually Helps
Sentry is widely used for error tracking in Python apps. It automatically catches errors, groups similar issues, and gives clear details for fixing them. Unlike normal logs where errors get lost, Sentry highlights problems and shows how they affect users.
It shows complete error traces with nearby code, so it is easy to see what failed. It also records small actions before the error, tracks affected users, and counts how often errors happen. This turns error fixing from guessing into data based decisions.
Integration requires minimal code:
import sentry_sdk
from sentry_sdk.integrations.flask import FlaskIntegration
sentry_sdk.init(
    dsn="your-project-dsn",
    integrations=[FlaskIntegration()],
    traces_sample_rate=0.1,
    environment="production"
)
try:
    process_payment(user_id, amount)
except PaymentError as e:
    sentry_sdk.capture_exception(e)
sentry_sdk.set_user({"id": user_id, "email": user.email})
sentry_sdk.set_context("payment", {"amount": amount, "currency": "USD"})
Sentry transforms error tracking from reactive firefighting to proactive monitoring. You can configure alerts to notify you when new errors appear or when existing errors spike. You can track error resolution across releases to ensure fixes actually work. The platform helps you prioritize which errors to fix first based on their frequency and user impact.
ELK Stack: Centralized Logging at Scale
When you operate multiple services, logs scattered across servers become unmanageable. The ELK stack (Elasticsearch, Logstash, Kibana) provides centralized logging that scales to billions of entries.
For Python applications, use Filebeat or send logs directly to Logstash:
import logging
from logstash_async.handler import AsynchronousLogstashHandler
logger = logging.getLogger('python-logstash-logger')
logger.setLevel(logging.INFO)
handler = AsynchronousLogstashHandler(
    host='logstash.example.com',
    port=5959,
    database_path='logstash.db'
)
logger.addHandler(handler)
logger.info('User logged in', extra={'user_id': 12345, 'ip_address': '192.168.1.1'})
The power of ELK emerges when querying logs across services, analyzing error patterns, and building real-time dashboards.
Datadog: All-in-One Monitoring Solution
Datadog combines application performance monitoring, log management, and infrastructure monitoring in a single platform. While premium-priced, the unified view often justifies the cost for production systems.
Instrumenting a Python application for Datadog:
from ddtrace import tracer, patch_all
patch_all()
@tracer.wrap(service='payment-service', resource='process_payment')
def process_payment(user_id, amount):
    with tracer.trace('validate_payment') as span:
        span.set_tag('user_id', user_id)
        validate_payment_details(user_id, amount)

    with tracer.trace('charge_card') as span:
        result = charge_card(user_id, amount)
        return result
Datadog excels at identifying performance bottlenecks across distributed systems with flame graphs and trace timelines.
OpenTelemetry: The Future of Observability
OpenTelemetry represents a vendor-neutral standard for collecting telemetry data. It provides unified APIs that work with multiple backends, avoiding vendor lock-in.
Basic OpenTelemetry setup:
from opentelemetry import trace
from opentelemetry.sdk.trace import TracerProvider
from opentelemetry.exporter.otlp.proto.grpc.trace_exporter import OTLPSpanExporter
from opentelemetry.sdk.trace.export import BatchSpanProcessor
trace.set_tracer_provider(TracerProvider())
tracer = trace.get_tracer(__name__)
otlp_exporter = OTLPSpanExporter(endpoint="localhost:4317")
trace.get_tracer_provider().add_span_processor(BatchSpanProcessor(otlp_exporter))
with tracer.start_as_current_span("process_order") as span:
    span.set_attribute("order_id", order.id)
    process_order(order)
OpenTelemetry shines in microservice architectures where you need consistent observability across services written in different languages.
Building a Complete Monitoring Strategy
Single tools help, but a strong system uses multiple methods together. A production app should have structured logs with Structlog or Loguru, metrics with Prometheus, error tracking with Sentry, and tracing with Datadog or OpenTelemetry.
Start with clean logging across the app. Add metrics for key performance numbers. Enable error tracking to catch failures. Use tracing if you work with microservices.
Good monitoring saves time during issues. You find the real cause quickly instead of debugging for hours. Teams move from fixing fires to improving systems. Most importantly, alerts warn you before users face problems.
Production monitoring means having clear data to make fast and smart decisions when issues happen. These tools give a solid base to build reliable systems users can trust.
Looking for more Python Tools? checkout my guide onhttps://medium.com/@inprogrammer/10-python-tricks-that-only-senior-developers-know-in-2026-with-examples-a734f933d04a